Third in the NursingHomesTexas.com data series. Texas has no statewide minimum direct-care staffing ratio. The federal data shows why that matters: staffing levels and staff turnover are among the strongest predictors of how often a Texas home gets cited - and how serious those citations are.
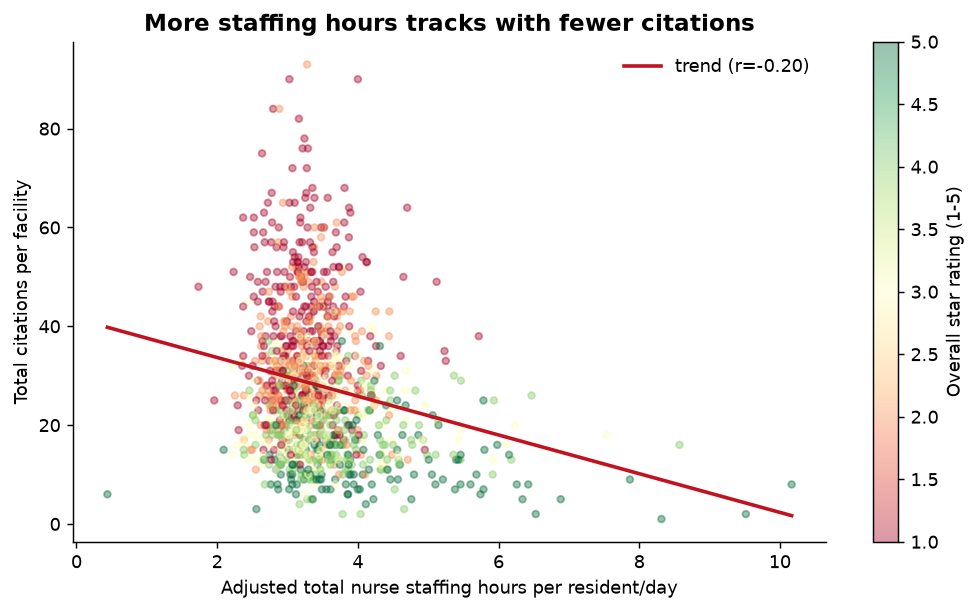
The dose-response in the data
Grouping the 1,148 Texas homes with reported staffing data into quartiles by adjusted total nurse staffing hours per resident per day:
| Staffing quartile | Homes | Citations / home | Serious / home | Avg. star |
|---|---|---|---|---|
| Q1 - lowest staffing | 287 | 29.4 | 2.40 | 2.34 |
| Q2 | 287 | 29.6 | 2.35 | 2.48 |
| Q3 | 287 | 29.1 | 2.51 | 2.57 |
| Q4 - highest staffing | 287 | 23.7 | 1.79 | 3.30 |
The best-staffed quartile records about 20% fewer citations than the lower three quartiles - and carries nearly a full star more in CMS's overall rating (3.30 vs 2.34 at the bottom). The relationship is flat across the lower three quartiles and then breaks sharply at the top: adequate staffing is where the record improves.
Turnover is an even cleaner signal
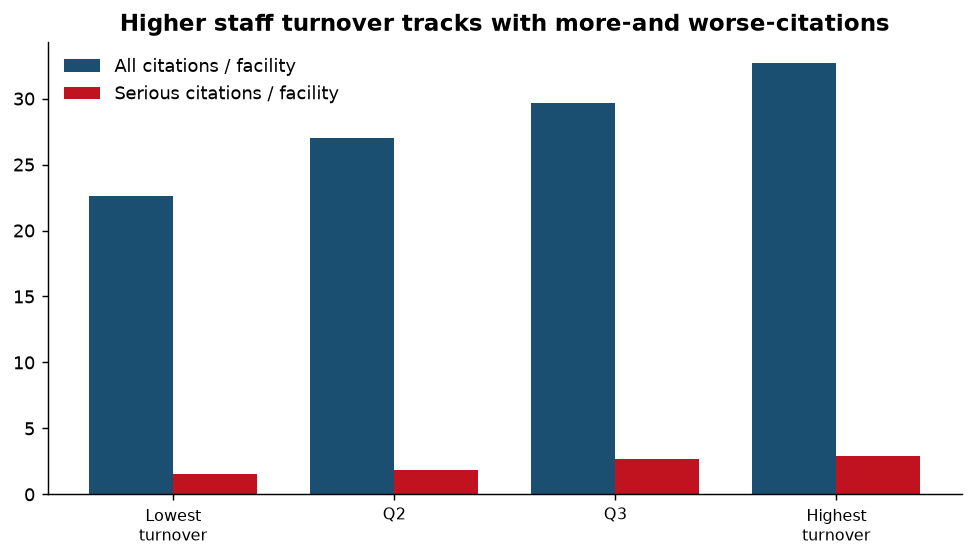
Grouping homes by total nursing staff turnover produces a near-perfect dose-response:
| Turnover quartile | Homes | Citations / home | Serious / home |
|---|---|---|---|
| Lowest turnover | 264 | 22.6 | 1.58 |
| Q2 | 265 | 27.1 | 1.88 |
| Q3 | 259 | 29.7 | 2.68 |
| Highest turnover | 263 | 32.7 | 2.94 |
Homes in the highest-turnover quartile record 1.9x the serious citations of the lowest-turnover group. A revolving door of nurses is not just a management problem - it shows up directly in the inspection record.
Correlations (all homes, n~1,148)
| Variable | Correlation with total citations |
|---|---|
| Adjusted total nurse staffing hours/resident/day | -0.20 |
| Total nursing staff turnover | +0.25 |
More nurse hours correlate with fewer citations; higher turnover correlates with more. Turnover is the stronger single staffing correlate in the Texas data.
Texas context
- The statewide average in this dataset is 3.46 adjusted total nurse staffing hours per resident per day, and 0.44 adjusted RN hours per resident per day.
- Average nursing staff turnover is 55.3%; average RN turnover is 54.6% - meaning a typical Texas home replaces more than half of its nursing workforce each year, among the highest rates in the country.
- 748 of 1,148 Texas homes (65%) report adjusted total nurse staffing below 3.5 hours per resident per day - the level California uses as its direct-care standard. Texas sets no such statewide minimum, and CMS measures nurse-only hours, so the two are not identical; but the comparison is telling.
- High turnover and thin staffing are the conditions regulators and plaintiff's attorneys most often point to after a serious incident. The population-level pattern in this study is the statistical version of that argument.
Methodology
- Staffing and turnover figures are the CMS-adjusted measures published in Provider Information (processing date 2026-09-01); citations are joined from Health Deficiencies by CCN.
- Quartiles are computed on homes with non-null staffing values; correlations use pairwise-complete observations.
- Correlation is not causation: case-mix, ownership and resident acuity all interact with staffing. These findings are associative.
Media enquiries: info@nursinghomestexas.com, or use the contact form at nursinghomestexas.com/contact.html.