Second in the NursingHomesTexas.com data series. Texas's certified nursing homes are spread across 217 counties - but the citation records they generate vary enormously, and the biggest counties are not always the ones with the worst per-home records.
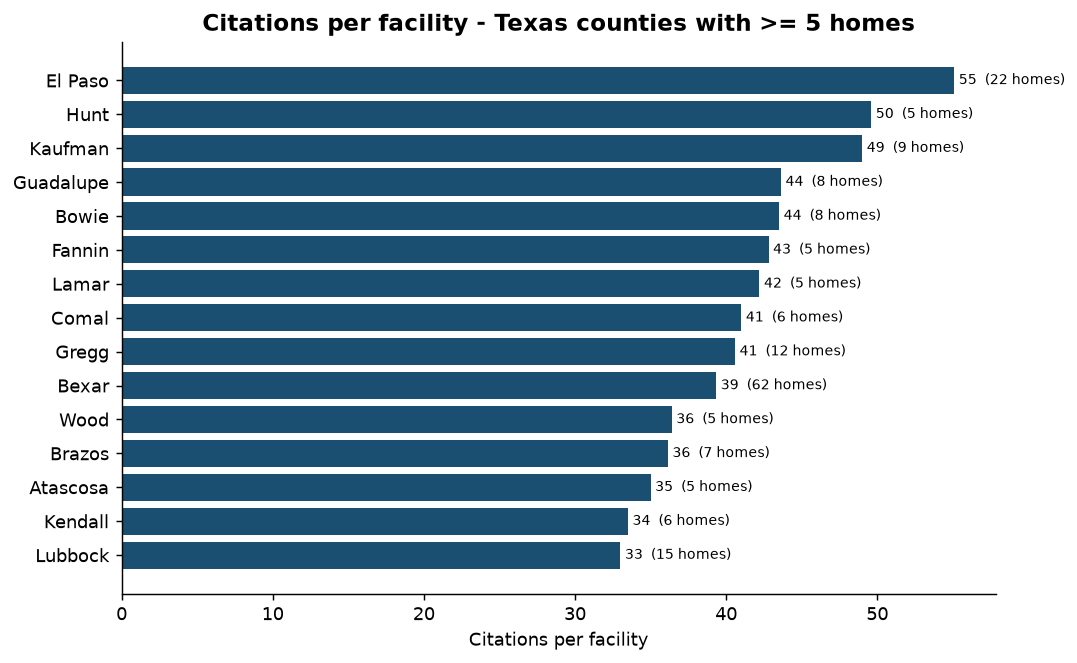
The county ranking
Among counties with five or more certified nursing homes (to avoid single-facility noise), average health-deficiency citations per home:
| Rank | County | Homes | Citations | Citations/home | Serious/home | Avg. star |
|---|---|---|---|---|---|---|
| 1 | El Paso | 22 | 1,212 | 55.1 | 2.14 | 1.68 |
| 2 | Hunt | 5 | 248 | 49.6 | 1.80 | 2.60 |
| 3 | Kaufman | 9 | 441 | 49.0 | 3.78 | 2.00 |
| 4 | Guadalupe | 8 | 349 | 43.6 | 2.00 | 2.00 |
| 5 | Bowie | 8 | 348 | 43.5 | 3.00 | 2.13 |
| 6 | Fannin | 5 | 214 | 42.8 | 2.60 | 2.20 |
| 7 | Lamar | 5 | 211 | 42.2 | 3.40 | 2.60 |
| 8 | Comal | 6 | 246 | 41.0 | 1.83 | 2.33 |
| 9 | Gregg | 12 | 487 | 40.6 | 4.08 | 2.08 |
| 10 | Bexar | 62 | 2,439 | 39.3 | 1.98 | 2.29 |
| 11 | Wood | 5 | 182 | 36.4 | 2.60 | 1.80 |
| 12 | Brazos | 7 | 253 | 36.1 | 3.71 | 1.86 |
The safest records (fewest citations per home) among counties with 5+ homes:
| County | Homes | Citations/home | Serious/home | Avg. star |
|---|---|---|---|---|
| Van Zandt | 6 | 11.7 | 0.83 | 3.33 |
| Limestone | 5 | 13.2 | 1.60 | 3.40 |
| Brown | 7 | 15.0 | 0.57 | 3.43 |
| Wichita | 10 | 15.6 | 0.60 | 3.78 |
| Montgomery | 12 | 18.3 | 2.25 | 2.82 |
A home in Van Zandt County records, on average, nearly five times fewer citations than a home in El Paso County.
The four biggest markets
Texas's largest counties tell very different stories:
| County | Homes | Citations/home | Serious/home | Avg. star |
|---|---|---|---|---|
| Harris | 97 | 22.9 | 3.47 | 2.63 |
| Dallas | 82 | 29.7 | 2.46 | 2.49 |
| Tarrant | 72 | 30.9 | 3.33 | 2.41 |
| Bexar | 62 | 39.3 | 1.98 | 2.29 |
Three stories in this map
1. Harris County is the severity hotspot
Harris County holds the most Texas homes (97) and the most abuse-flag facilities in the state - yet its homes record the fewest citations per home of the four biggest counties (22.9). That is not good news. Harris homes average 3.47 serious (actual-harm or immediate-jeopardy) citations each - the highest per-home severity rate of any large county. Fewer paperwork findings, but more findings that involved harm.
2. There are two different kinds of "high"
El Paso County has the highest raw citations-per-home (55.1) with a 1.68-star average - a pattern of many lower-level findings at struggling facilities. Kaufman (49.0 per home), Gregg (4.08 serious per home) and Lamar (3.40) show the opposite: fewer homes, but a far higher share of findings that involved harm. Volume and severity are not the same thing, and the most alarming counties are sometimes not the biggest.
3. The border and the Permian lead on volume
The highest citations-per-home counties cluster in West Texas and the Rio Grande border (El Paso) and the Northeast Texas corridor (Hunt, Kaufman, Fannin, Lamar, Bowie). The strongest records run through East and Central Texas (Van Zandt, Limestone, Brown, Wichita). This tracks the ownership and staffing patterns documented in studies 3 and 4 - hospital-district and rural facilities behave differently from urban for-profit chains.
Methodology
- Counties are drawn from the
County/Parishfield of CMS Provider Information, joined to each facility's deficiency citations by CCN. - The ranking is restricted to counties with >=5 certified homes; Texas has many counties with one or two homes, where a single inspection can distort the average.
- "Serious/home" counts citations at severity G-L (actual harm or immediate jeopardy).
- Source: CMS Provider Data, processing date 2026-09-01. Derived from the public CMS datasets described above.
Media contact: info@nursinghomestexas.com